如何在圖表中添加客制化的Y軸標籤?
目標:顯示特定值的平行線,Y軸有此特定值的客制標籤(本來的預設值Y軸值還要在)
Posted Updated 
By
4 min read
如何在圖表中添加客制化的Y軸標籤?
如何在 Charts 圖中添加客製化的Y軸標籤?
在 Charts 中設定自訂 Y 軸文字與格式
目標:顯示特定值的平行線,Y軸有此特定值的客制標籤(本來的預設值Y軸值還要在)
遇到問題: 用 addLimitLine 畫平行線,數值是顯示在線的上左右、下左右,而不是在Y軸。 用 Label 貼數值在Y軸,但因為圖表有縮放,甚至有做整個圖表的上下拉伸,Label 與線的位置會跑掉。
前輩建議的方法是:最好的方法就是不要用label 直接用chatRenderer去畫
所以自己建一個 YAxisRenderer的問題:
- 怎麼把資料加入Y軸去畫標籤?
- 怎麼客制標籤?
嘗試從 Charts 內去找繪製Y軸的 func :
覆寫 func computeAxisValues(min: Double, max: Double) 加入特定數值產生圖表物件
覆寫 func drawYLabels (context: CGContext, fixedPosition: CGFloat, positions: [CGPoint], offset: CGFloat, offset: CGFloat, textAlign: NSTextAlignment) 顯示客制的Y軸標籤該怎麼顯示
1
2
3
4
5
6
7
8
9
10
11
12
13
14
15
16
17
18
19
20
21
22
23
24
25
26
27
28
29
30
31
32
33
34
35
36
37
38
39
40
41
42
43
44
45
46
47
48
49
50
51
52
53
54
55
56
57
58
59
60
61
62
63
64
65
66
67
68
69
70
71
72
73
74
75
76
77
78
79
import Charts

/// 讓K線圖Y軸可以顯示指定數值標籤
class KLineRightYAxisRenderer: YAxisRenderer {

    /// 指定數值
    var specificValue: Double?

    // MARK: - Init

    convenience init(chart: BarLineChartViewBase) {
        self.init(viewPortHandler: chart.viewPortHandler,
                  yAxis: chart.rightAxis,
                  transformer: chart.getTransformer(forAxis: .right))
    }


    /// Sets up the axis values. Computes the desired number of labels between the two given extremes.
    override func computeAxisValues(min: Double, max: Double) {
        super.computeAxisValues(min: min, max: max)

        // 將指定數值加進y軸
        guard let axis = self.axis,
              let value = specificValue else { return }

        var values = axis.entries
        if value < max, value >= min, !values.contains(value) {
            values.append(value)
        }
        axis.entries = values

    }

    /// draws the y-labels on the specified x-position
    override func drawYLabels (context: CGContext,
                               fixedPosition: CGFloat,
                               positions: [CGPoint],
                               offset: CGFloat,
                               textAlign: NSTextAlignment) {
        guard let yAxis = self.axis as? YAxis else { return }

        let labelFont = yAxis.labelFont

	// 設定一般/客制文字顏色
        var labelTextColor = yAxis.labelTextColor
        let specificLebelTextColor: UIColor = .init(red: 76/255, green: 37/255, blue: 39/255, alpha: 1)

	// 設定一般/客制背景顏色
        var labelBgColor: UIColor = .clear
        let specificLabelBgColor: UIColor = .init(red: 251/255, green: 238/255, blue: 185/255, alpha: 1)

        let from = yAxis.isDrawBottomYLabelEntryEnabled ? 0 : 1
        let to = yAxis.isDrawTopYLabelEntryEnabled ? yAxis.entryCount : (yAxis.entryCount - 1)

        for i in stride(from: from, to: to, by: 1) {
            var text: String = ""
            let entrie = yAxis.entries[i]
            // 找跟特定數值一樣的去客制標籤
            if entrie == specificValue {
		text = "\(entrie)"
                labelTextColor = specificLebelTextColor
                labelBgColor = specificLabelBgColor
            } else {
                text = yAxis.getFormattedLabel(i)
                labelTextColor = yAxis.labelTextColor
                labelBgColor = .clear
            }

            ChartUtils.drawText(
                context: context,
                text: text,
                point: CGPoint(x: fixedPosition, y: positions[i].y + offset),
                align: textAlign,
                attributes: [.font: labelFont, .foregroundColor: labelTextColor, .backgroundColor: labelBgColor]
            )
        }
    }

}
20行:繼承本來的 func 內容再繼續擴充
27行:檢查特定數值是否在圖表顯示範圍內,且檢查是不是已經存在於本來就會顯示的數值
59行:如果設定的特定數值相同,套用要客制的標籤設定
74行:要客制的標籤特徵
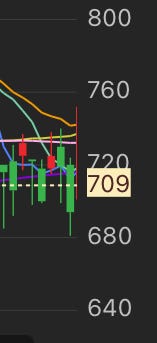
成果效果
Post converted from Medium by ZMediumToMarkdown.
This post is licensed under CC BY 4.0 by the author.